2023 Annual Disability Statistics Compendium

Rural

Section 10: Rural

Sponsored by The Research and Training Center on Disability in Rural Communities (RTC:Rural) at the Rural Institute for Inclusive Communities at the University of Montana.

The Office of Management and Budget (OMB) separates U.S. counties into metropolitan and non-metropolitan counties based on population thresholds and commuting patterns (shown in the map below). Counties are classified metropolitan if they contain an urban core of at least 50,000 people or if a significant proportion of the population commutes into an adjacent urban core. Non-metropolitan counties can be further classified into micropolitan and noncore counties, with micropolitan counties having an urban core of 10,000 to 50,000 people and noncore counties being those that remain. Although metropolitan, micropolitan, and noncore designations do not fully describe the varied conditions across place, they suggest that infrastructure and associated economic and demographic factors contribute to the rural experience. 

A map showing the distribution of metropolitan, micropolitan and noncore counties across the US (including Puerto Rico). There are 1,251 metropolitan counties which are shown in yellow. There are fewer metropolitan counties, 665 and these are shown in light green. More counties are noncore, the most "rural", with 1,305 dark green counties.

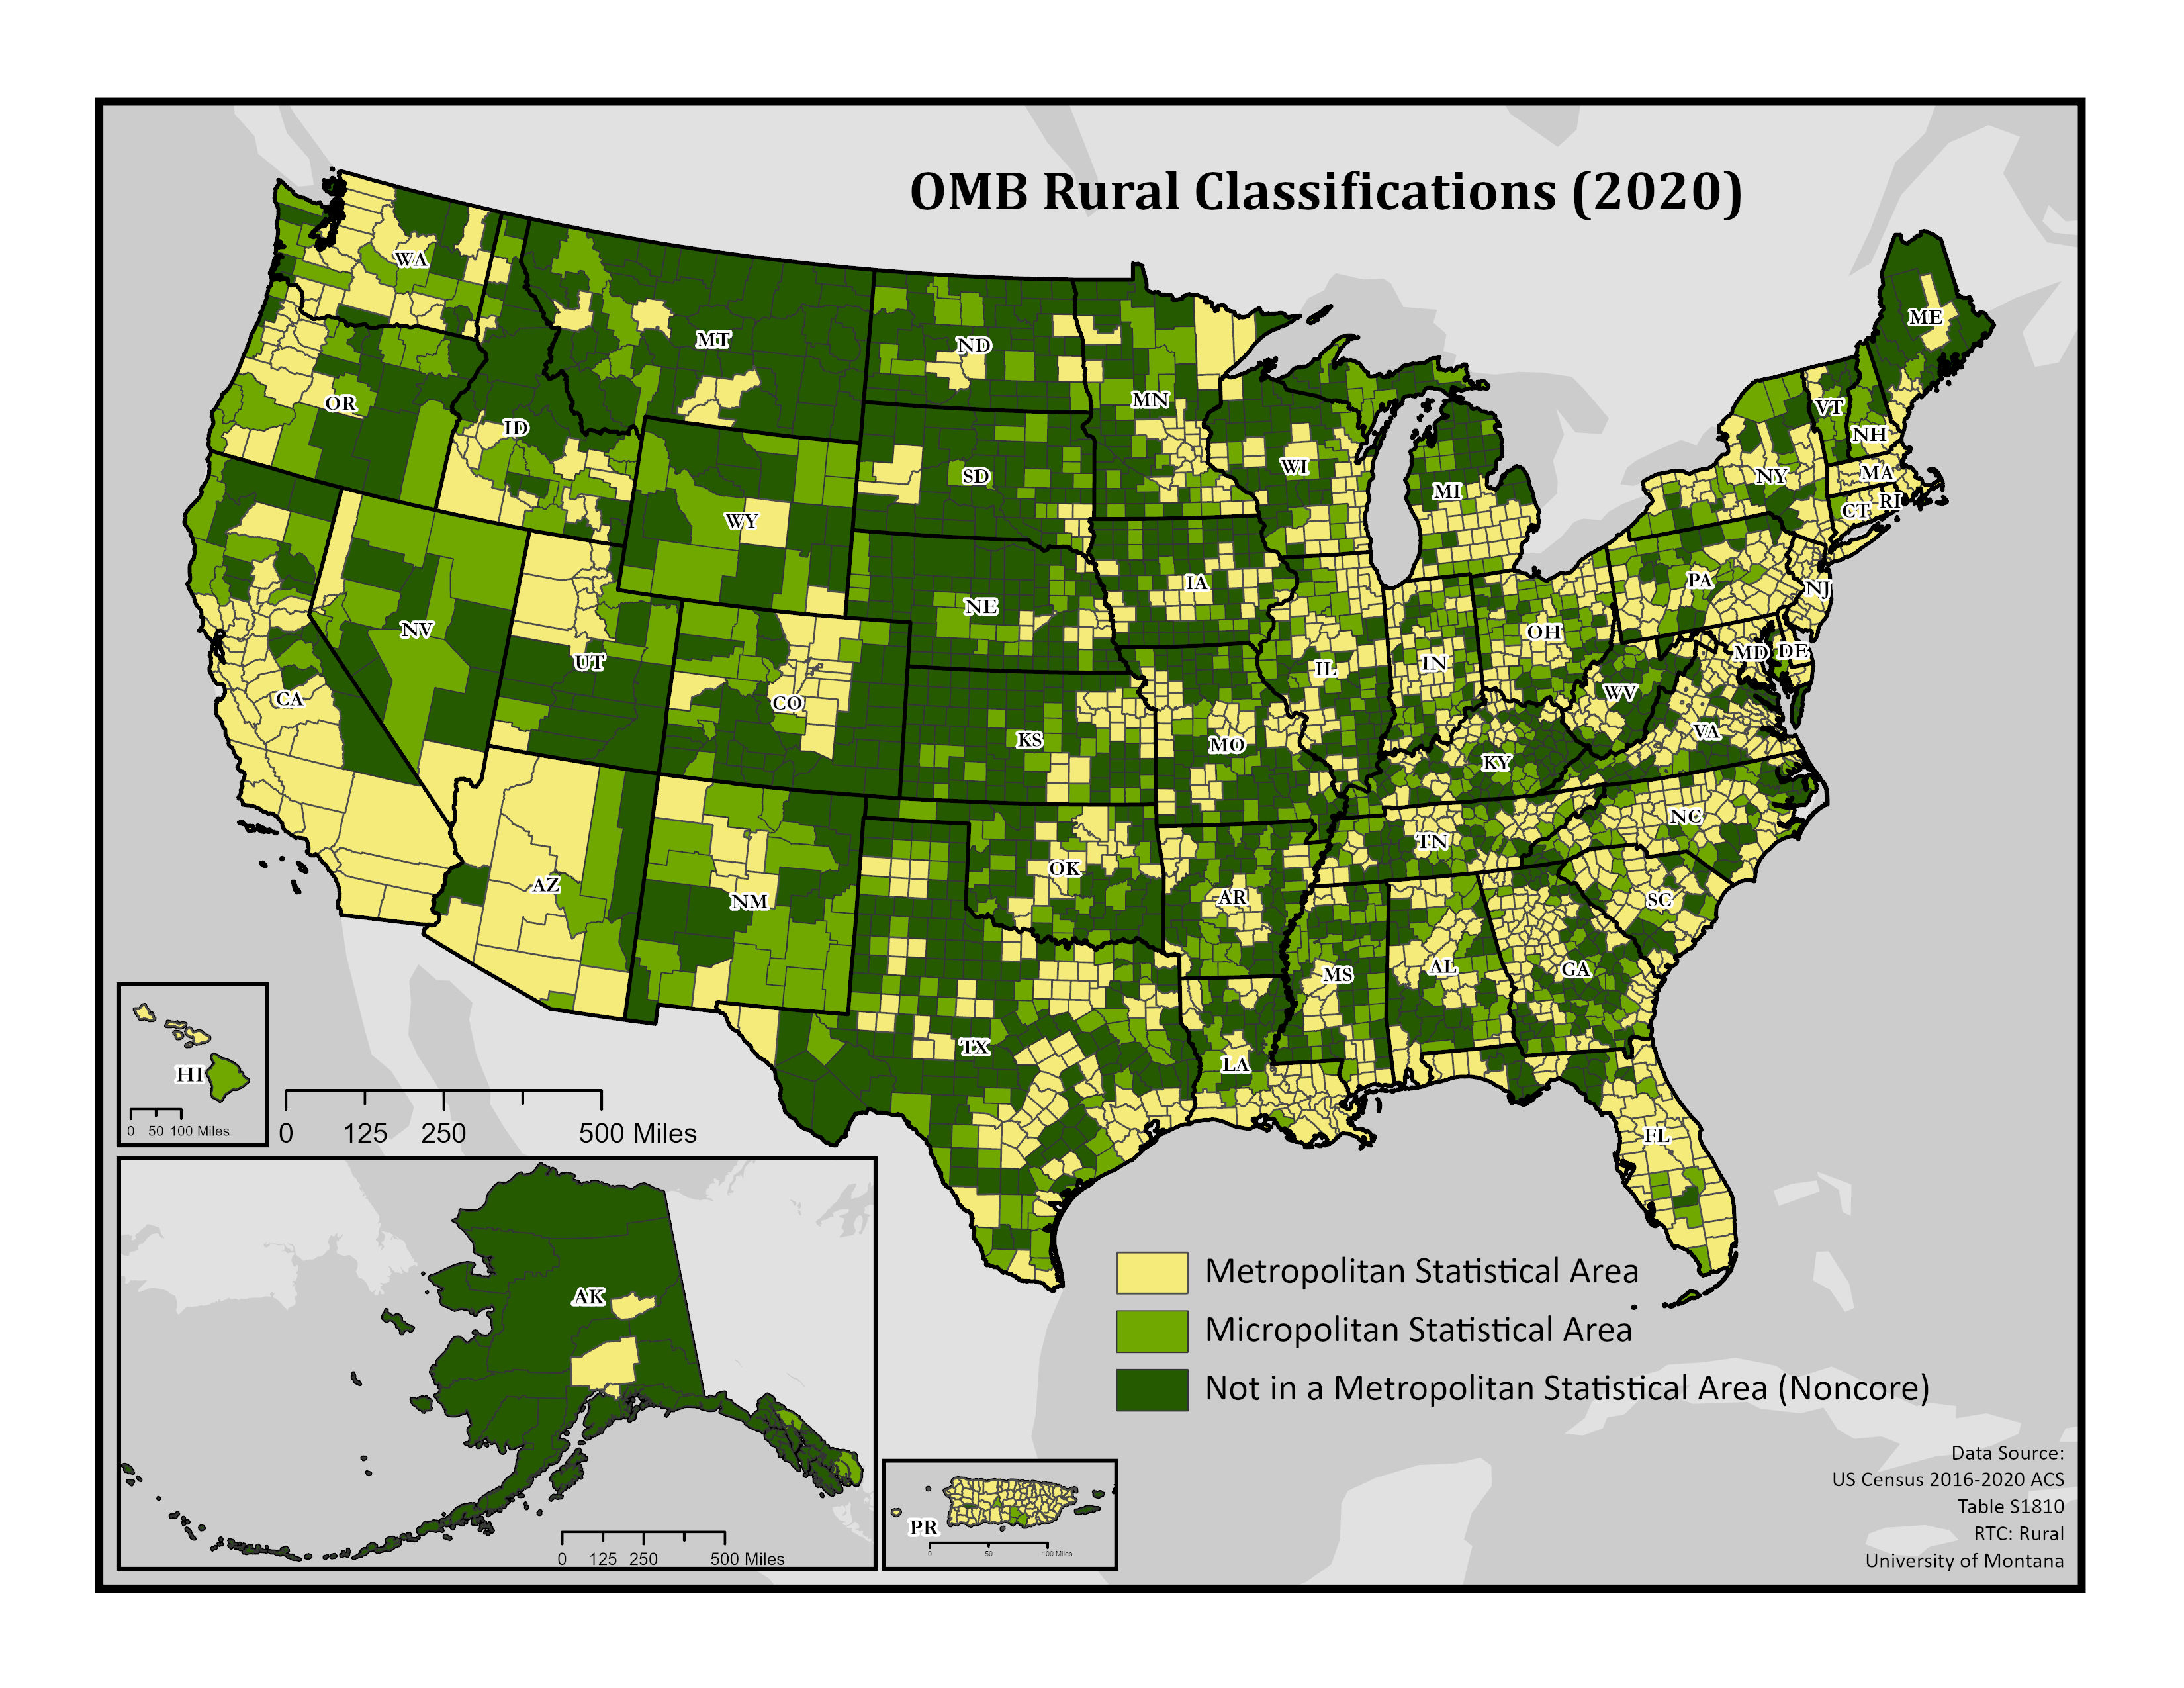
Map Description: A map showing the distribution of metropolitan, micropolitan and noncore counties across the US (including Puerto Rico). There are 1,251 metropolitan counties which are shown in yellow. There are fewer micropolitan counties, 665, and these are shown in light green. More counties are noncore, the most "rural", with 1,305 dark green counties. 


Contextual differences between metropolitan and non-metropolitan counties shape both the experiences and outcomes of people with disabilities and often result in inequities across place. As counties become more rural (non-metropolitan), a wide range of disparities grow.

Data representative of the U.S. population are used to inform the development of policies and programs at the local, state, and national levels. Available data on rural disability, however, is limited and frequently imprecise.  For instance, the American Community Survey (ACS) uses a continuous data collection timeline, where new data are added every month to generate a sample equal to 12.5% of the total population every five years. The continuous nature of ACS data collection and resulting sample size affects the availability and validity of rural data. For counties with populations of 65,000 or less, raw data must be aggregated across five years before it is released.  This constitutes 74% percent of U.S. counties. Due to a change in disability indicator questions in 2008, the first 5-year data file with rural disability indicators was not available until December 2013. To avoid overlapping data collection periods, it wasn’t until 2018 that rural outcomes could be compared over time using ACS data.

Additionally, analyses of rural data are limited because of smaller sample sizes and high margins of error (MOE). This is a particular problem for examining rural subgroup data such as rural disability rates by race. High MOE make data less reliable for smaller geographies and necessitates that researchers aggregate data across counties or years to increase precision. Because of these types of limitations, there is a need to expand the availability and quality of rural data for policy and program development, using a tailored approach.

The goal of providing rural annual and trend data in collaboration with the StatsRRTC is to improve access to accurate and current data about the disability experience in rural communities. These data can be used by advocates, service providers, researchers, and policy makers for making informed arguments, developing sound decisions, building hypotheses, and understanding policy impacts. This effort will raise awareness of how rural people with disabilities are similar to and different from their urban counterparts.  It will allow stakeholders to more easily access a wide range of information about the disability experience in rural communities to make informed decisions about programs and policies likely to benefit rural people with disabilities.

Methods

The Rural Addendum provides data on key sociodemographic characteristics for people with and without disabilities residing in metropolitan, micropolitan, and noncore counties. Data come from the 2016-2020 American Community Survey (ACS) 5-year summary files. To calculate metropolitan, micropolitan, and noncore populations, we first classified county-level data based on 2020 OMB classifications. We then aggregated populations across these metropolitan, micropolitan, and noncore designations to explore geographic differences. For all tables, disability status is based on having responded “yes” to at least one of a series of six disability indicator questions in the ACS. The glossary contains the questions used in the ACS to arrive at the disability estimates. Note that all table estimates exclude persons living in institutions and active duty military personnel. Some questions are asked only of people of certain ages.

Tables

Table 10.1 reports on the prevalence of disability in the United States. For the 5-year period from 2016-2020, the estimated rate of disability was 12.1% for metropolitan, 16% for micropolitan, and 17.8% for noncore counties.  Estimated rates were higher in noncore counties for all reported disabilities, including hearing, vision, cognitive, ambulatory, self-care, and independent living disabilities.

Tables 10.2a & 10.2b provide demographic information for people with and without disabilities living in metropolitan, micropolitan, and noncore counties. Trends in the data show that as counties become more rural there are higher rates of White and AIAN populations, and lower rates of Asian, NHPI, multi-racial, and Hispanic populations for both people with and without disabilities. Rates of African American/Black people are higher in metropolitan areas and lower in micropolitan and noncore counties.  

Table 10.3 compares employment and work experience rates for people with and without disabilities.  As counties become more rural, the employment rate decreases and the “not in the labor force” rate increases for people with and without disabilities. Notably, 63.5% of the population with disability living in noncore counties was not in the labor force, and 60.9% did not work in the past 12 months.  

Table 10.4 shows poverty rates by age and median earnings for people with and without disabilities. Poverty rates for people with and without disability increase for all age groups as counties become more rural. Poverty rates are most pronounced for individuals living in noncore counties, where 33.2% of the population less than 18 years, 30% of the population 18-64 years, and 14% of the population 65 years and older lives at or below the poverty level. When comparing median earnings, people with disabilities receive significantly less income in metropolitan, micropolitan, and noncore counties when compared to those without disabilities. The median earnings difference between people with and without disabilities, however, is smallest in noncore counties.

Table 10.5 shows health insurance coverage and type for people with and without disabilities. As places become more rural, people with and without disability report lower rates of insurance coverage. For all geography (metropolitan, micropolitan, and noncore), people with disabilities report lower rates of private insurance, and higher rates of public insurance, relative to those without disabilities.

Table 10.1 Rural Comparison — Prevalence and Population of Civilians Living in the Community with and without Disabilities, by Metropolitan, Micropolitan, and Noncore Status for the United States: 2020
Metropolitan Classifications Any Disability [1] Disability Type
Vision Hearing Cognitive Ambulatory Self-Care Independent Living
Metropolitan                                                                           
Disability                                                                           
Count  34,059,285 6,355,307 9,268,552 13,048,095 17,161,516 6,703,552 12,184,283
Rate (%)        12.1       2.3       3.3        4.7        6.1       2.4        4.3
No Disability                                                                           
Count 246,357,643     X         X         X          X          X         X     
Rate (%)        87.9     X         X         X          X          X         X     
                                                                            
Micropolitan                                                                           
Disability                                                                           
Count   4,276,314   817,600 1,316,099  1,595,459  2,180,115   768,524  1,430,010
Rate (%)        16.0       3.1       4.9        6.0        8.2       2.9        5.4
No Disability                                                                           
Count  22,427,949     X         X         X          X          X         X     
Rate (%)        84.0     X         X         X          X          X         X     
                                                                            
Noncore                                                                           
Disability                                                                           
Count   3,144,119   608,175 1,029,458  1,107,581  1,668,299   573,869  1,045,623
Rate (%)        17.8       3.4       5.8        6.3        9.5       3.3        5.9
No Disability                                                                           
Count  14,490,541     X         X         X          X          X         X     
Rate (%)        82.2     X         X         X          X          X         X     
Table 10.2a Rural Comparison — Demographics of Civilians Living in the Community with and without Disabilities, by Metropolitan, Micropolitan, and Noncore Status for the United States: 2020
Metropolitan Classifications Total (Overall Prevalence) Age Groups Sex [1]
Less than 18 Years 18 to 64 Years 65 Years and Over Male Female
Metropolitan                                                                      
Disability                                                                      
Count  34,059,285  2,710,895  16,866,763 14,481,627  16,294,034  17,765,251
Rate (%)        12.1        8.0        49.5       42.5        47.8        52.2
No Disability                                                                      
Count 246,357,643 61,144,526 156,519,036 28,694,081 120,492,583 125,865,060
Rate (%)        87.9       24.8        63.5       11.6        48.9        51.1
                                                                       
Micropolitan                                                                      
Disability                                                                      
Count   4,276,314    302,528   2,158,246  1,815,540   2,136,998   2,139,316
Rate (%)        16.0        7.1        50.5       42.5        50.0        50.0
No Disability                                                                      
Count  22,427,949  5,705,427  13,639,738  3,082,784  11,010,033  11,417,916
Rate (%)        84.0       25.4        60.8       13.7        49.1        50.9
                                                                       
Noncore                                                                      
Disability                                                                      
Count   3,144,119    203,684   1,534,849  1,405,586   1,609,214   1,534,905
Rate (%)        17.8        6.5        48.8       44.7        51.2        48.8
No Disability                                                                      
Count  14,490,541  3,706,622   8,530,989  2,252,930   7,126,372   7,364,169
Rate (%)        82.2       25.6        58.9       15.5        49.2        50.8
Table 10.2b Rural Comparison — Demographics of Civilians Living in the Community with and without Disabilities, by Metropolitan, Micropolitan, and Noncore Status for the United States: 2020
Metropolitan Classifications Race and Ethnicity [1]
White African American American Indian/Alaska Native Asian Native Hawaiian /Pacific Islander Other Two or More Races Hispanic/Latino (of Any Race)
Metropolitan                                                                                     
Disability                                                                                     
Count  24,245,101  5,072,728   277,778  1,284,810  58,826  1,539,927  1,580,115  5,649,842
Rate (%)        71.2       14.9       0.8        3.8     0.2        4.5        4.6       16.6
No Disability                                                                                     
Count 167,304,800 31,950,806 1,382,190 16,605,846 476,453 14,789,040 13,848,508 52,194,057
Rate (%)        67.9       13.0       0.6        6.7     0.2        6.0        5.6       21.2
                                                                                      
Micropolitan                                                                                     
Disability                                                                                     
Count   3,610,572    337,364    88,990     29,515   6,889     58,302    144,682    302,240
Rate (%)        84.4        7.9       2.1        0.7     0.2        1.4        3.4        7.1
No Disability                                                                                     
Count  18,636,221  1,652,656   401,731    303,675  43,692    516,375    873,599  2,441,149
Rate (%)        83.1        7.4       1.8        1.4     0.2        2.3        3.9       10.9
                                                                                      
Noncore                                                                                     
Disability                                                                                     
Count   2,686,052    252,107    78,600     10,026   1,674     28,415     87,245    130,288
Rate (%)        85.4        8.0       2.5        0.3     0.1        0.9        2.8        4.1
No Disability                                                                                     
Count  12,237,774  1,068,885   398,995     97,386   9,823    251,694    425,984  1,067,586
Rate (%)        84.5        7.4       2.8        0.7     0.1        1.7        2.9        7.4
Table 10.3 Rural Comparison — Employment of Civilians Ages 18-64 Years Living in the Community with and without Disabilities, by Metropolitan, Micropolitan, and Noncore Status for the United States: 2020
Metropolitan Classifications Employment Work Experience
Employed Unemployed Not in the Labor Force Worked Full Time Worked Part Time Did Not Work
Metropolitan                                                                  
Disability                                                                  
Count   6,530,301   896,987  9,439,475  4,127,988  3,626,844  9,111,931
Rate (%)        38.7       5.3       56.0       24.5       21.5       54.0
No Disability                                                                  
Count 121,317,041 6,405,656 28,796,339 89,567,641 41,402,898 25,548,497
Rate (%)        77.5       4.1       18.4       57.2       26.5       16.3
                                                                   
Micropolitan                                                                  
Disability                                                                  
Count     752,666    97,183  1,308,397    470,300    441,468  1,246,478
Rate (%)        34.9       4.5       60.6       21.8       20.5       57.8
No Disability                                                                  
Count  10,351,750   529,514  2,758,474  7,594,346  3,696,010  2,349,382
Rate (%)        75.9       3.9       20.2       55.7       27.1       17.2
                                                                   
Noncore                                                                  
Disability                                                                  
Count     498,185    62,735    973,929    319,703    279,741    935,405
Rate (%)        32.5       4.1       63.5       20.8       18.2       60.9
No Disability                                                                  
Count   6,409,316   330,585  1,791,088  4,791,979  2,170,773  1,568,237
Rate (%)        75.1       3.9       21.0       56.2       25.4       18.4
Table 10.4 Rural Comparison — Poverty and Median Earnings by Age of Civilians Living in the Community with and without Disabilities, by Metropolitan, Micropolitan, and Noncore Status for the United States: 2020
Metropolitan Classifications Poverty [1] Earnings ($)
At or Below Poverty Line Less than 18 Years 18 to 64 Years 65 Years and Older Total Male Female
Metropolitan                                                                         
Disability                                                                         
Count  6,823,098    705,724  4,189,347 1,928,027 24,897.15 30,433.57 20,721.97
Rate (%)       20.1       26.6       25.0      13.3     X         X         X    
No Disability                                                                         
Count 28,539,247 10,119,502 16,205,528 2,214,217 35,165.71 42,096.15 29,084.56
Rate (%)       11.7       16.8       10.5       7.7     X         X         X    
                                                                          
Micropolitan                                                                         
Disability                                                                         
Count    954,066     93,565    621,350   239,151 22,220.67 27,531.81 18,273.77
Rate (%)       22.5       31.8       29.1      13.2     X         X         X    
No Disability                                                                         
Count  3,168,190  1,165,615  1,757,862   244,713 31,573.03 38,234.99 25,571.89
Rate (%)       14.4       20.8       13.2       7.9     X         X         X    
                                                                          
Noncore                                                                         
Disability                                                                         
Count    720,917     65,503    458,286   197,128 23,884.65 29,563.82 19,674.06
Rate (%)       23.0       33.2       30.0      14.0     X         X         X    
No Disability                                                                         
Count  2,086,175    792,030  1,104,591   189,554 32,964.33 39,837.17  26,851.3
Rate (%)       14.5       21.8       13.1       8.4     X         X         X    
Table 10.5 Rural Comparison — Insurance Coverage for Civilians Living in the Community with and without Disabilities, by Metropolitan, Micropolitan, and Noncore Status for the United States: 2020
Metropolitan Classifications Insurance Coverage [1]
Private Public None
Metropolitan                                  
Disability                                  
Count  17,011,055 24,933,878  1,837,134
Rate (%)        49.9       73.2        5.4
No Disability                                  
Count 174,951,409 71,888,272 22,137,378
Rate (%)        71.0       29.2        9.0
                                   
Micropolitan                                  
Disability                                  
Count   2,074,407  3,250,983    254,302
Rate (%)        48.5       76.0        5.9
No Disability                                  
Count  15,156,533  7,609,426  2,233,569
Rate (%)        67.6       33.9       10.0
                                   
Noncore                                  
Disability                                  
Count   1,469,951  2,445,668    194,608
Rate (%)        46.8       77.8        6.2
No Disability                                  
Count   9,423,734  5,262,325  1,621,687
Rate (%)        65.0       36.3       11.2
Map of Disability in America (2020)

Map Description

Reported rates of disability vary across the country with a notable difference between rates in urban and rural counties. In aggregate, we see higher rates in rural counties across a variety of indicators (see table 10.1). However, rural disability rates are not consistent and clear geographic and regional patterns emerge when exploring these data on a map. The map above shows disability rates at the county level for every county in the United States. Rates are classified by quartile with lower rates shown in lighter purple and higher rates in darker purple. There are clear geographic clusters of both high and low rates of disability throughout the U.S.

There are higher rates of reported disability throughout the rural Southern United States in Appalachia, Southern Missouri and Arkansas, along the border of Mississippi and Alabama and across New Mexico into Southern Colorado. Clusters of high rates of reported disability can also be found in rural areas of Maine, Michigan, Idaho, California and Oregon. Finally, there are high rates of reported disability throughout Puerto Rico.

There is also a noticeable regional pattern where reported rates of disability are lowest. States in the North and Middle Atlantic region as well as across the Midwest, Great Plains and Rocky Mountain West (with the exception of Northern Idaho) all have lower rates of reported disability.

The forces underlying these geographic clusters are complex. Local level social, economic and environmental factors all contribute to people’s experience of disability. Communities and regions experiencing persistent and historical poverty, extractive industry dependence and other forms of social, spatial, and economic marginalization tend to report higher levels of disability. Improving our understanding of how and why rates of disability vary across rural America is valuable for developing effective policies and programs to serve rural people with disabilities.

For more information check out the RTC:Rural’s Disability Counts webpage where you can view and download additional maps for both the nation and states and access disability data by county using our data lookup tool.  http://resources.ruralinstitute.umt.edu/resource/disability-counts/